On Friday, September 26, the tender offer period for Mandom Corporation’s MBO officially began.
First and foremost, we appreciate the Board of Directors and the Special Committee of Mandom for providing detailed responses to our four questions regarding concerns that the proposed MBO price may be too low, as outlined in the recent “FAQ about “Notice regarding Expression of Opinion in favor of Planned Implementation of MBO and Recommendation to Tender Shares”. That said, as shareholders, we must note that your responses still leave two important issues unresolved. In both cases, the figures and methodologies provided fall short of the clarity and level of detail that investors are entitled to expect.
The first point relates to the Free Cash Flow (“FCF”) figures used by both financial advisors, Daiwa Securities (“Daiwa”) and Plutus Consulting (“Plutus”), in their DCF valuations. To help all shareholders understand the situation, we have summarized how the DCF valuation ranges from both advisors compare to the currently proposed TOB price in Figure 1 below.
Figure 1: Price suggested by both financial advisors using DCF valuation method
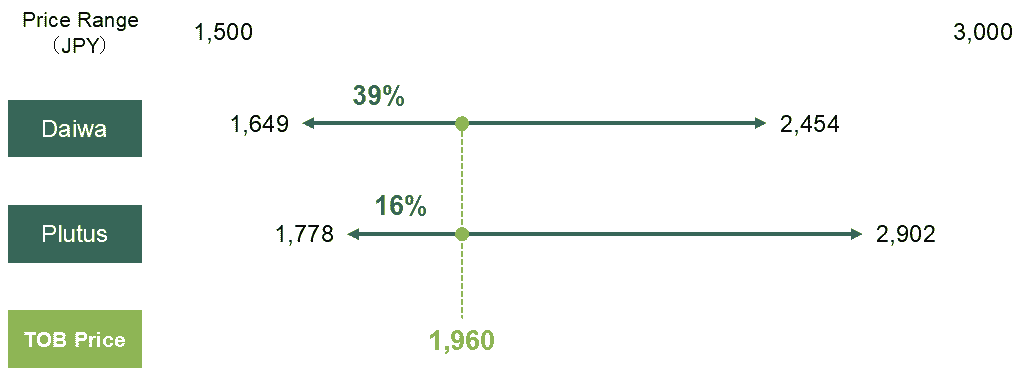
(Source:Notice regarding Expression of Opinion in favor of Planned Implementation of MBO and Recommendation to Tender Shares )
In our prior communication, we specifically raised the following question regarding the significant difference between the two FCF calculations:
“Daiwa’s FCF estimates for FY3/26 to FY3/28 in total are JPY 7.8 bn lower than Plutus’s, with the variance in the first year of FY3/26 (a nine-month period) alone amounting to JPY 6.0 bn. (redacted) We therefore inquire how these substantial differences in FCF assumptions were reconciled and justified within the Special Committee, and, during the subsequent Board deliberations leading to its resolution of support, whether the magnitude and sources of these discrepancies in underlying assumptions were questioned. If such concerns were raised, we further request that you disclose to shareholders the explanations provided by the advisors and the Board secretariat in response.”
In response, the explanation provided was that, assuming the turnover period remains roughly in line with historical levels, the differences in how working capital was calculated—Plutus at the consolidated group level, and Daiwa broken down by Japan, Indonesia, Malaysia, and Other—along with other methodological assumptions, caused the FCF estimates to diverge. Specifically, it was noted that:
“ In Daiwa Securities’ calculation, the Indonesian business’s revenues are expected to grow substantially in the fiscal year ending March 2026 compared with other periods, and it therefore assumes a large increase in working capital items such as accounts receivable and inventories with the revenue growth. As a result, the calculation shows a large decrease in FCF in the initial fiscal year (the nine-month period ending March 2026).”
At first glance, this explanation may appear reasonable. However, we have some concerns about the claim that the main driver of the JPY 6.0 bn difference in FCF between the two FAs can be attributed almost entirely to increased working capital in the Indonesia business this fiscal year.
As shown in Figure 2 below, Mandom Corporation’s projected sales for the Indonesia business stand at JPY 17.2 bn. This represents an increase of JPY 3.8 bn from the previous fiscal year, with the 9-month increase being roughly JPY 2.5 bn. Given that working capital is projected to rise by JPY 6.0 bn—more than double the sales increase—there seems to be a significant gap between the assumptions used for Mandom’s consolidated Cash Conversion Cycle (CCC) and those applied specifically to the Indonesia business.
Figure2:Mandom Corporation FY 3/26 Performance Outlook 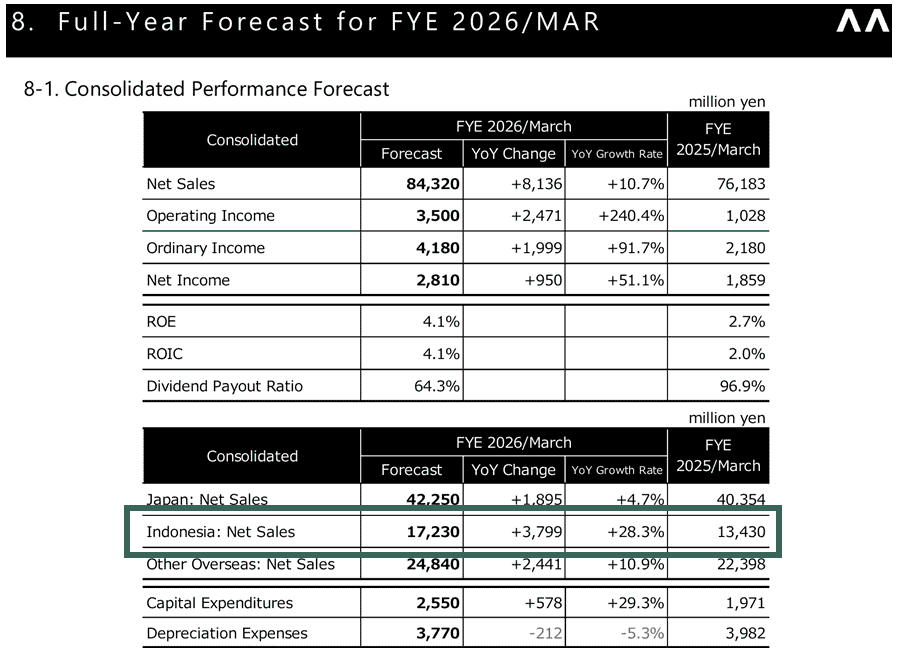
(Source: Annual Report FY 3/25 p. 34)
However, it should be noted that the average CCC over the past three years for Mandom on a consolidated basis and for its Indonesian subsidiary, PT mandom indonesia Tbk (a locally listed entity), has been 164 days (consolidated) and 172 days (Indonesia), according to Bloomberg. This indicates that there is no material difference between the two.
Furthermore, PT mandom indonesia Tbk has already disclosed its 2Q results, where CCC was 162 days (from Bloomberg), which is in fact shorter than its historical average. We therefore believe no major shift in the underlying operational environment.
Given the above, and as noted in Mandom’s own response, “For the business projection period, Daiwa Securities generally set each business segment’s working capital turnover period on the basis that it would continue at a level consistent with historical periods,” we struggle to see how the JPY 6.0 bn gap in FCF could be explained solely by the Indonesia business.
Next, on the reasons given for not using a Comparable Multiple Valuation method, we acknowledge the response provided and summarize it as follows:
- Plutus: Considered that the company’s growth profile diverged significantly from peers, rendering a multiple-based comparison inappropriate
- Daiwa: While attempting to select listed companies with a focus on sales targeted to Asia, found that valuation multiples varied widely across comparable peers, and therefore deemed the approach unsuitable
From our understanding, however, the essence of a Comparable Multiple Valuation Method lies precisely in understanding how the capital markets are currently valuing a group of broadly similar companies with differences in growth prospects, profitability, and other factors. In other words, it is a methodology that seeks to infer valuation in reverse, so to speak, from Adam Smith’s concept of the ‘invisible hand’. In that sense, the very reasons cited by both advisors for excluding the Comparable Multiple Valuation Method (differences in growth profile and wide dispersion of multiples) are, in fact, why we consider the comparable approach a necessary reference point.
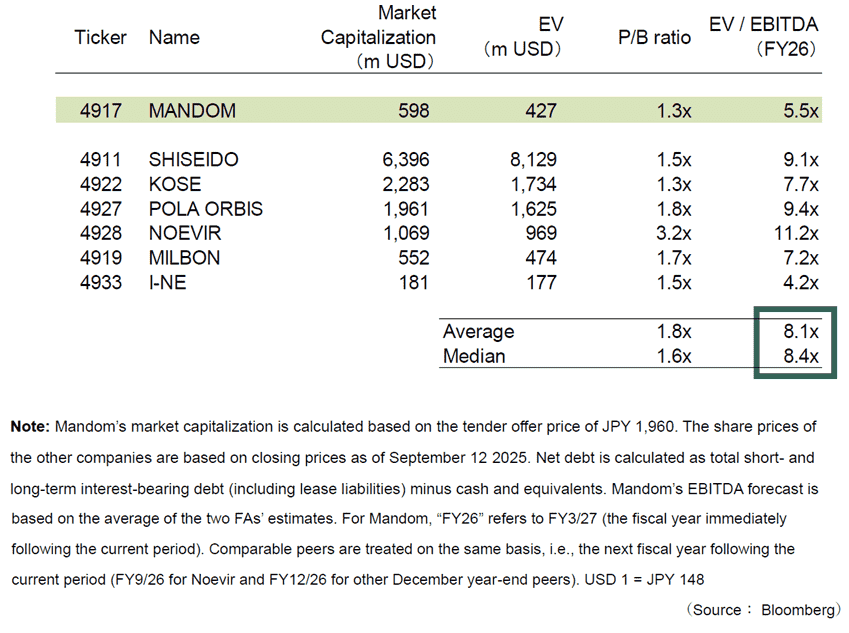
Tokyo Stock Exchange, on July 7 this year (effective July 22), announced “Revisions to Securities Listing Regulations and Other Rules Pertaining to MBOs and Subsidiary Conversions”, explicitly calling for more extensive disclosure to ensure that general shareholders have sufficient information to assess the fairness of such transactions. We therefore hope that our questions will serve to further evolve and deepen the debate on appropriate valuation approaches in the context of MBOs and TOBs—transactions that are likely to remain a recurring feature of Japan’s capital markets. For reference, we reproduce below the figure from our September 15 letter.
Figure 3:Comparison with Comparable Companies
As we have stated previously, in this MBO transaction, we acknowledge that, through the diligent efforts of the Special Committee during negotiations, the initially proposed MBO offer price of JPY 1,600 was increased on seven times to a final price of JPY 1,960. We also have no objection to the overall rationale, background, and objectives that led to the pursuit of this MBO, and we hope that the deal will ultimately be closed in the spirit of “Sanpō Yoshi”, delivering benefit to all three stakeholders. That said, from the perspective of minority shareholders, the TOB price of JPY 1,960 still falls short of fully reflecting Mandom’s true intrinsic value. Thus, we hereby present our opinion to the Board of Directors of Mandom, to fellow shareholders, and to other market participants.
(Related Posts)
22/Sep/2025 – The Toyo Keizai article regarding the MBO of Mandom Corporation
16/Sep/2025 – Letter of Inquiry to Mandom CORPORATION
This post does not constitute a solicitation for an offer to acquire or recommend the purchase or sale of specific securities, or advice on investment, legal, tax, accounting, or any other matters.